a candle on and off

PICTURES COMING SOON

Air, not air, and super-air: how does a candle burn in air, carbon dioxide, and pure oxygen? It’s easy to create these three different conditions and learn a bit of chemistry. If you have a vacuum chamber you can even fine tune the combustion.

Air that’s not air: extinguishing a candle, or …:

Equipment: a candle, and matches or a lighter to light it; a cup (optional) to put it into; another cup for mixing; baking soda; and vinegar. For an option you can also get some hydrogen peroxide and an old alkaline battery (cell).

How candles burn: Chemicals that allow burning of common fuels and chemicals that don’t: We light a candle and the flame on the wick heats up the wax around it, even making into vapors. Those vapors are composed of the elements carbon and hydrogen, both of which readily combine with oxygen when they are hot enough. (I put the chemical equation at the end, so as not to interrupt the narrative here.) Ordinary air has 21% oxygen when dry, 78% nitrogen, and 1% argon, a noble gas (very loath to react with any other chemical). Water vapor dilutes these a bit, up to about 6% in the most humid livable conditions for us humans. Candle wax, and most things we think of as combustible, don’t react with nitrogen in the air, but, hey, there’s enough oxygen for most fires that we want… and for our “controlled fires” in our bodies, our respiration that’s done with the help of many proteins in our cells. That’s another very detailed story that I won’t go into here.

Carbon dioxide is a gas that looks just like air, that is, transparent, invisible to the human eye, even if it’s extra-visible in the infrared that we can’t see. It’s present in ordinary air at generally low concentrations. Averaged around the globe it’s at about 415 parts per million in free air. In a closed room just our breathing may raise it to several percent; it had better not reach 10% or we can die from a few discrete effects on our bodies. Our breath is about 2% CO2. If we hold our breath we can get it to about 20% CO2, not a great idea to keep doing. CO2 does not support the burning of candle wax. In fact, it’s one of the final products of burning candle wax, the other part being water vapor.

The set-up: Basically, we can make pure CO2 readily by reacting common household chemicals, vinegar and baking soda. We can collect it in a cup and then pour it onto a candle. It can collect because it is denser that air and sits at the bottom of the cup. Its molecules weigh more (have a higher mass) than air molecules. So, light the candle. In a cup, say, a coffee cup, put some baking soda in it; use about ½ teaspoon; even ¼ tsp is enough if you’re careful. Slowly pour in about a tablespoon of vinegar. The mass will foam; don’t let it overflow. Let the bubbles pop. You might cover the cup with a piece of paper to avoid losing too much CO2 to air currents in the room. Now carefully hold the cup over the candle flame, safely high enough not to get burned or to burn your cup if it’s paper. Tilt the cup reasonably quickly to let the CO2 fall right onto the top of the candle flame. It will go out, because CO2 won’t support combustion.

PICTURES

Variations: First, put the candle into a cup that is, say, a few cm (an inch, plus) taller than the top of the wick. Instead of pouring the CO2 directly onto the wick, pour it into the cup that’s holding the candle. Do this slowly, so that the CO2 will rise as a layer. When the CO2 reaches the height of the wick the flame will go out. Of course, you won’t see the CO2 but you’ll see its effect when the candle flame goes out. Second, try adding more oxygen instead of replacing oxygen. There are several ways to do this, but BE CAREFUL. An easy one is to pour about 5 milliliters (a teaspoon) of common hydrogen peroxide solution into the mixing cup. Open a packet of dry yeast and sprinkle some into the hydrogen peroxide. The enzyme catalase in the yeast cells will cause a huge release of pure oxygen gas. Pour it onto the candle flame, very carefully – the flame will rise higher and hotter, so keep a decent distance above the flame. The rate of combustion increases with the concentration of oxygen, as this shows.

There’s a way to decrease the amount of oxygen available to the candle flame in any amount. We can put the candle into a vacuum chamber and slowly draw out the air. That demo is described in a bigger demo about using the vacuum chamber.

The chemical equations: For wax burning in the oxygen in the air: the chemical makeup of candle wax is closely CH2, in units all joined together into somewhat long chains. Let’s look at just one unit:

A couple of things: First, there’s that water on the side showing the results, or products of combustion. Second, note that I use what is called an improper fraction, in which the numerator is bigger than the denominator. That’s almost the universal practice in science. It’s so much easier and less prone to error than using two-part proper fractions such as 1-1/2, when you multiply or divide numbers. Third, the fraction is a fraction of “jillions” of molecules; there are no half molecules. The number of molecules in, say, 1 gram of wax (about 1/5 of a teaspoon) is greater than ten to the 21st power, the digit 1 followed by 20 zeroes. The number of oxygen molecules involved is much greater.

What’s happening with hydrogen peroxide? That’s H2O2 – water with an extra oxygen atom in each molecule. It’s prone to break up and give up that oxygen:


a chemical changes color with temperature

PICTURES ARE COMING

Hot = blue, cold = pink. How does that happen in a simple solution? The metal cobalt dissolved as an ion can take on different colors. It depends on which other ions surround it. We can change that by adding acid or adding water… and, surprisingly, just by warming or cooling a balanced solution. Get ready for some chemistry and a story about energy.

Change a solution from pink to blue and back – just cool it or heat it

Equipment and supplies: Here is a pictorial list

Costs: Labware is something you’d like for many demonstrations and experiments: small balance (properly called a magnetic force balance or scale; $20); weighing paper ($3; use smooth paper, in a pinch); beakers, in several sizes ($5 each); test tubes in one or more sizes ($1 each); test tube rack ($5); graduated cylinder ($10; get glass, not plastic); pipettor ($100, with tips; very useful; in this demo you can just pour carefully, but it’s tedious); tongs for test tubes ($2); hot plate ($80 or more; get a stirring hot plate and some Teflon-coated stir bars); thermally insulating gloves ($12)

Specific to this experiment: cobaltous chloride ($21 at Carolina Biological Supply for 100g, which is a lot)

Precautions: Cobalt compounds are toxic, so don’t expose yourself to them; they can be absorbed through the skin; use gloves. Hydrochloric acid is very corrosive, and the gaseous form of HCl is very noxious and can damage your lungs and eyes. Take care with the heated solution and especially with the hot plate. Have an acid neutralizer such as baking soda handy to take up acid spills.

Picture of two states

Many chemicals have intriguing colors or beautiful colors. There’s the deep purple of solutions of potassium permanganate, the violet sheen of iodine crystals, the gold of iron pyrite. Most colors are unaffected by temperature, but here is a fascinating and instructive case.

The chemical state of metal atoms in solution: Most metals can be nicely dissolved, especially in acids. The atom of the metal loses one or more electrons, becoming a positive ion; one electron lost 🡪 singly charged ion, such as the sodium ion, Na+; two electrons lost 🡪 doubly charged ion, such as the ferrous ion, Fe2+, or, for this demo, the cobaltous ion, Co2+. Many metals have multiple possible state, including cobalt as the cobaltic ion, Co3+, which we’ll leave here.

We often look at metal ions in solution. They must be accompanied by positive ions of equal charge in the whole solution; it’s possible to calculate the force of electrical repulsion if the charges aren’t balanced, and in a tiny amount of solution the forces are akin to nuclear weapons. In aqueous (watery) solutions, the Co2+ ion gets surrounded by a number of atoms or molecules. Some are right on the ion, as things called ligands (“tied”) and others sit outside this coordination shell as counterions that balance the total electrical charge to zero.

Ions moving between two states: In this experiment, we put the ion in a solution with chloride ions. There are two well-defined states. In one of them, which we can call water-complexed, the surrounding molecules are all water molecules. We write its formula as [Co(H₂O)₆]²⁺. It has two positive charges, so that there must be two negative charges right outside – in our case, as two negative chloride ions, Cl. The other state has four negative chloride ions on the cobaltous ion. We write it as [Co­Cl4]²⁻. It has two negative charges, so that there must be two positive hydrogen ions right outside, (overly)simply written as H+.

We got all this stuff into solution by dissolving cobaltous chloride in water and then adding hydrochloric acid. We’ll play with which ligands, water or chloride, get preference around the cobalt, by adjusting the concentration of acid and the temperature. Cobaltous chloride comes with water attached, as CoCl2◦6H2O. We add hydrochloric acid, HCl, in the right amount to get the cobaltous ion poised between its two states. (Side note: hydrochloric acid is properly the solution of the gaseous molecule HCl in water, but we’ll use common shorthand.)

Making the solutions: Fill a graduated cylinder (tall container with volume markings) with pure water to the 40 milliliter (40 ml) mark. Pour it into an ordinary beaker (that’s the straight-sided cylindrical container with a pouring lip). Weigh out 4 grams of cobaltous chloride and add it to the water. You’ll get a rosy red solution. Label it as, say, Col2, for short, and also label it as toxic. [The 4g here would be enough to make an adult quite sick and could kill a very small child. As all organisms, we need cobalt in the form of vitamin B12 but a tiny excess is harmful.] Now measure out 60 ml of concentrated hydrochloric acid, CAREFULLY. HCl is dangerous and must be handled with great care. It is not simply an acid that can corrode things. The HCl gas coming off the acid solution is suffocating and quickly damaging to lungs, eyes, etc. Do not breathe near the solution. Add the HCl to the cobaltous chloride solution. You’ll get a nice violet solution. Divide this solution into 5 or more test tubes for a series of demonstrations.

Demo 1: Swapping water or chloride ligands for changing colors: Take two test tubes that each have some of the original solution. Drop water into one solution and swirl it well to mix after each drop. Keep adding water. At some point the solution will turn a definite pink. You’ve now created the water-complexed state as the dominant form. In the other tube add drops of HCl with mixing. It will eventually turn a definite blue, with cobalt in the chloride-complexed state. You can reverse the effects. Add HCl to the first tube and you’ll eventually get it to turn blue; add water to the second tube and you’ll get it to turn pink.

PICTURES

Demo 2: Balancing the complexes and pushing them to one side or the other with temperature: Fill a beaker with the original solution and add HCl dropwise with stirring until you get a nice intermediate violet color (if you overshoot, add a little water). This solution will be very sensitive to temperature. Divide it roughly equally into three test tubes. Prepare hot water, to boiling, in a beaker on a hot plate. Beware of getting your hands in the “steam” above the beaker. Also prepare ice water in another beaker, just by adding ice to water. Now place one test tube in the hot water, holding the tube with tongs or with waterproof thermally insulating gloves. It will turn blue, the color of the chloride-complexed cobaltous ion. Put another tube in the ice bath. It will turn pink, the color of the water-complexed cobaltous ion. Of course, you could do this with one tube, but it’s nice to see all three colors at the same time as a clear demonstration of the changes.

Move the cold tube to the hot water and the hot tube to the ice bath and they’ll both reverse their colors! You can keep reversing them.

PICTURES

What’s happening in demo 2: Both water molecules and chloride ions are hanging around the Co2+ ion in the solutions. Both bindings are happening all the time. At any constant temperature there will be a balance, an equilibrium with each state forming and breaking up. Which one dominates depends on the temperature. When chloride ions dominate, more energy is released as heat than when water molecules dominate. If we add heat by increasing the temperature we are counteracting the release of heat, pushing the balance or equilibrium back toward the original side. The counteraction of this chemical shift on the force or perturbation we apply is described as Le Chatelier’s Principle. We can look at the reversible process of changing which ligands are on cobalt as this balance or equilibrium:

Pink side: [Co(H₂O)₆]²⁺ +4Cl⁻ ↔ [Co­Cl4]²⁻ + 6H₂O₅ + liberation of heat: Blue side

The two-headed arrow indicates that both forward and backward changes occur.


adding up colors

MORE PICTURES TO COME

Adding up colors: We’re all used to mixing paints or crayon colors and getting darker and darker colors. Adding colors gives us a very different experience, and we only need three different colors, red, green, and blue. This happens all the time in digital displays; there are simple ways to see this in near-microscopic detail. We can also make our own color mixer, or color adder, with three LEDs.

Let’s mix colors, both adding and subtracting them

Color perceived as a mix of three primary colors: We humans mostly have three different color-sensing cells in our eyes, in our retina. Each one responds to a different range of colors (wavelengths) of light. You can think of them as responding, very broadly, to red (one type of cone), to green (another type), and to blue (the third type). We get a certain mixture of “colors” in light as it is emitted by various sources – the sun, a lamp, … – and possibly reflected or transmitted by various surfaces – a leaf, a colored windowpane, … Our brain interprets any given mix of colors of light as a particular overall color or hue. We all know the experience and we may know a lot of different hues by name. There is also value or lightness, denoting how bright overall the light us, and there is saturation, denoting how diluted the color is by mixed-in white, such as pink being a mix of pure red and some white. There are some tricky parts, explained in a number of books or websites, such as hues looking different depending on nearby hues in a scene, but let’s leave that here. In any event, we can create a color as a hue, a saturation, and a value by getting three different pure color sources – red, green, and blue – and adjusting the brightness of each. Again, there are tricky parts because sources with very narrow bands of color miss some features – it’s why some color prints can’t be made to look exactly the way they appeared to our eyes; that, too, is another story. Here, we are going to see how three different colored light sources can make a great range of colors.

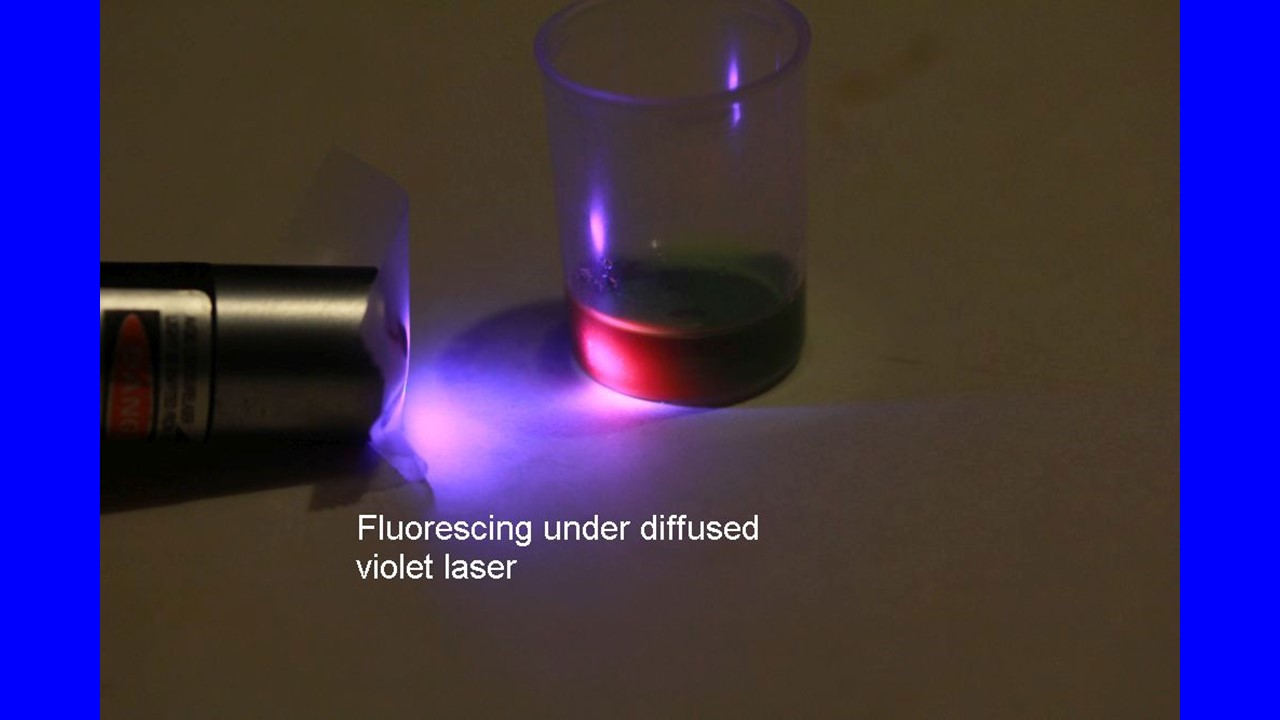
Short notes: Some people lack one or more color receptors. We call them color-blind, or, more appropriately, color-confused. They see all the colors but they seem different; some of them mix up greens and reds, for example. Some people have had their corneas – front of the eye – removed surgically, and they see ultraviolet light that the rest of us don’t. Bees also see ultraviolet. The mantis shrimp has 13 different color receptors but only sees a small range of hues; a lot of the receptors register other properties of light, including its polarization (more on that in other demos or experiments).

Several methods of adding colors: Adding colors is done all the time in a digital color display, though it can be hard to see it happening, so, let’s mix them under our control, with three (or more) ways of doing this:

— Lighting up 3 light-emitting diodes (LEDs), one each of re, green, and blue. We can vary the relative brightness of each LED to create different colors. For some of you, it may seem counterintuitive that adding red, green, and blue light makes white, while mixing red, green, and blue pigments as paint or as crayon streaks makes black, or nearly so depending on the crayon and paint exact colors. We can build a color mixer from simple electronic parts and a supporting box. We’ll get to the details below.

— Watching a color monitor of a computer add up colors from its many small picture elements, or pixels. Viewed from a normal distance, the colors from individual red, green, and blue (RGB) pixels blend in our eyes to make any specific color. We’ll need a camera with a close-focusing or macro lens to be able to see the individual pixels, which have to be quite small.

— Browsing to a website such as http://www.cknuckles.com/rgbsliders.html, where we can use our mouse to set the levels of R, G, and B light on a big square in our monitor.

First method: adding the output of 3 LEDs:

Equipment: We’ll build a small box with the LEDs, a battery for power, and controls for the level of output of each LED, with a small area where we view the colors mixing. We need:

* One each of a red, a green, and a blue LED, all of comparable light output at maximum. There are many places to buy these. For these and for all kinds of electronic parts, I recommend DigiKey.com. Get LEDs that have a peak current of 20 to 40 millamperes (mA). You’ll use the battery, below, to create currents to light them up, and electrical resistors to control just how much goes though each LED – that is, how bright each one is;

* A 9-volt battery and associated stuff: a “lead clip” that snaps onto the terminals to provide two wires you can attach to the rest of the circuit, and a handy clip to hold the battery to the box you’ll build; it simply snaps about the battery body;

* A resistor of fixed, low resistance for each LED, to limit the peak current so that you won’t burn out your LED. Suppose your LED has a peak current I of 20 mA or 0.020 amperes. The red LED has a voltage “drop” of about 2.2 volts, just to start current flowing (and it varies only a little with current). That leaves 6.8V to drop across the resistor. From Ohm’s law (which you can look up, if it’s not familiar to you), the resistor you need has the value R0 = V/I, or 6.8V/0.020A = 340 ohms (symbol Ω). It’s not critical to have that exact value, so choose common and very inexpensive 330 Ω resistor. It will have little current through it to heat it up, so you can use a low-power resistor, 1/8 watt or ¼ watt, though any power rating will work if you have a resistor handy. For the green LED, the voltage drop will be about 2.8V and for the blue about 3.3V. You can use resistors for these with slightly smaller values, but it’s not critical;

* A variable resistor or potentiometer for each LED, to vary the current. You want its highest resistance to limit the brightness to, say, 1% of maximum. So, you need a potentiometer rated at 100 times higher resistance, or about 33,000 Ω. You won’t find one for sale, so pick one that’s relatively close – say, 50k Ω (kilohms). There are several kinds of potentiometers that vary in “taper,” which is how rapidly or in what pattern the resistance varies with the turn of its dial. A convenient taper is called audio – it starts changing slowly and then more rapidly as you move the dial. The proportional increase in resistance is about the same along each fraction that you turn the dial. This will make the changes in brightness fit the sensitivity of our eyes. We notice relative changes in brightness, not really absolute changes. This will make the effects very clear;

* An on-off switch for convenience, as an alternative to pulling the lead clip off the battery each time to shut it down (and an alternative to leaving the color mixer on and running down the battery). A simple single-pole single-throw switch will work. Single-pole means that we are only going to control one wire, as the circuit diagram will show. Single-throw means that there is only one on-position and the other is an off-position. Be sure to get a toggle switch that stays in the position you want; there are also momentary-contact switches that revert the moment you stop pressing them;

* A set of “hardware” to mount all this stuff – particularly a nice clear or translucent plastic box to hold everything and a piece of thin, stiff, insulating board (“perfboard”) on which to mount the LEDs and the resistors. A full list is at the end;

* A piece of thin, diffusing plastic to “mix” the lights on a space you’ll use to observe the results;

* Some side-cutters, pliers, solder, and a soldering iron to make all the connections. Side-cutters let you cut wires and the leads of the resistors and the LEDs to handy lengths. They can also be used, with some skill you readily acquire, to strip insulation off the battery clip leads; otherwise, use a small, sharp knife with care. Needlenose pliers are handy for holding the LED leads while you solder to them. They act as “heat sinks” to much reduce the heat going into the LED and possibly damaging it. It’s handy to tie their handles together with a stiff rubber band so that the jaws stay clamped and the whole setup is stable while you solder. Learning to use a soldering iron is a handy skill. Be prepared to get a small burn or two, almost as a right of passage.

The pictures here show stages of assembly. There’s also a standard schematic of the electrical circuit. Getting familiar with conventional symbols is very useful

Using the device: Hey, play with it. Change the amounts of each LED’s light output and look where the light patches overlap. You can readily see that mixing approximately equal intensities of red and green gives us an even brighter yellow. Mixing red and blue gives us a pretty magenta, or a reddish or a bluish version of magenta. Mixing all three colors gives us an approximate white. I say “approximate” because the colors of common LEDs don’t quite fill in all the color space. In any event, this is an inexpensive device that is handy for demonstrations.


Method 2: looking at a color monitor on a computer to see the tiny colored pixels that blend in our eyes

Equipment: There are several ways to do this. I’ll present one that I found handy. Needed: a computer displaying colors in any desired pattern on its monitor ($0, if you have a computer; I assume you do, since you’re likely reading this on the screen); a digital camera such as a single-lens reflex or a newer mirrorless camera. You’ll want one that displays what it is seeing on an LCD screen on its back; a macro lens that lets the computer focus very close on a small area of the monitor. I use a Canon 60mm macro that will go to an enlargement of 1-to-1 (some macro lenses do much less, such as 1-to-5 even; you’ll want at least 1-to-2).

How to see the pixels: Pixel, is, of course, short of picture element. The computer monitor is covered with a million or so pixels. Let’s look at some in detail. Get an interesting color-varied display on the monitor. I put a hard surface such as a clipboard on my laptop computer’s keyboard so that I won’t be pressing keys and going off-scene. I set my macro lens to focus as closely as possible; that gives it 1-to-1 enlargement. I put the camera on the clipboard and click the control that shows the camera image on the camera’s back screen. Then I move it closer or farther from the screen so that the pieces of the screen, the pixels, are in focus. If you do the same you’ll see a grid of many very small and tall rectangles. Push the control on your camera that lets you magnify the image. Zow! You see all the patches of red, green, and blue that make up the monitor screen. You may want to save the image by taking the picture. You can move the camera around to various parts of the scene on the monitor that differ in color, hence differ in how much the red, green, and blue pixels light up.

PICTURES or video

How pixels work: On my laptop monitor there is just a repeating array of red, green, and blue pixels across the screen horizontally, with about 766 arrays stacked on top of each other vertically. Under commands from the graphics card, each red, green, or blue pixel is allowed to pass a fraction of the white light behind them. The balance of R, G, and B determines the color. Note that the pixels are not like LEDs; they do not actively emit light. They only passively pass part (or even all) of the white light behind them. Each pixel has its own precisely made color filter behind it… a better match to the R, G, and B of our visual cones than is the set of colors of the R, G, and B of the LEDs in the first method. The way that the pixel light transmission is controlled is shown brilliantly in a video by the Engineer Guy, XXX, as he takes apart a computer monitor. It’s well worth watching, more than once. To continue, at our normal viewing distance from the monitor the pixels’ light all blends into one part of our visual image, so that our eyes – and our brain – interpret the mix as a specific color, a hue, a saturation, and a value.

Method 3: find a website that lets us set the RGB color mix in a big patch on the computer screen

Equipment: Just your computer. Navigate to http://www.cknuckles.com/rgbsliders.html . You’ll see three “sliders” that you can drag with your mouse to set any level of R and G and B

CAROUSEL

Play with it. Of course, you don’t get to see how the individual pixels light up, but you can have a lot of fun wit the colors. You’ll see advertising claims that monitor model X can display 16 million or so colors. It can display that many different mixes of RGB colors (though maybe not fully reliably – a slight voltage change might make a 1% change in all intensities, which is about the same as smearing out 3 of the 256 different levels of each R, G, and B pixel). Human vision is not that finely attuned. We can discriminate about 20,000 colors, and, among these, maybe 200 different hues, the rest of the variation being in saturation and value. Some people say we can see 1 million colors; don’t count on it, and we don’t need it; we have very rich color vision, in any case!


Chlorophyll’s magic

MORE PICTURES TO COME

Green, green chlorophyll – it glows red (it fluoresces) and that’s a tell-tale for how active a green plant is…even across the globe seen from space. With an inexpensive violet laser pointer you can explore quite a bit about this very unusual molecule. Try this both inside the leaf and outside the leaf. Here’s the link for interesting times with green stuff.

Fluorescent color from chlorophyll, and a lot of insight into photosynthesis

Equipment and supplies: simple, fairly cheap ($12 to $40, depending on your kitchen holdings)

Chlorophyll captures red and blue light and gives off deeper red light, called fluorescence. There are several ways to see this, and one that’s now readily available at minimal cost is using a violet laser pointer. You can get a set of red, green, and violet laser pointers for about $12 online, say, at WalMart. Please see the note of caution about laser pointers at the end.

Here’s how it works. A few, select molecules such as chlorophyll and the pigments in “neon” markers and paints absorb one color of light and then emit some of that energy as light of a different color. Put simply:

* the light they absorb rearranges the electrons in the molecule into a higher energy state;

* the electrons can substantially reverse the process and emit light, which we call fluorescence. In almost all other kinds of molecules, this process is much, much slower than other processes that simply convert the electronic energy into heat; then, we don’t see energy coming out as light.

Chlorophyll is a wildly exceptional molecule in many ways that suit it to plants (and some bacteria) using it to capture the energy in light to transfer it finally to a chemical “factory” that runs a series of steps to store the energy in making stable compounds such as sugars. Its ability to fluoresce is a sideshow to its remarkable qualities that I touch on at the end here.

We can see chlorophyll fluoresce in its native state inside a leaf or else extracted from a leaf into a solvent; we can do both, readily. You need to get Chl (a handy abbreviation) to absorb light and then seen the emission of light. That emission is very, very fast, occurring in a few picoseconds, trillionths of a second. OK, Chl can absorb red light as from a red laser pointer and then emit slightly different red light… but we’re not able to shut off the red laser pointer and then see the red fluorescence, at least, not by eye!

The trick is to have Chl absorb light of a very different color, violet and then readily distinguish the red light coming with our eyes that are sensitive to many colors. Find a nice green leaf on a plant and shine the violet laser pointer onto it. Immediately you’ll see a pink glow where the laser light hits. You’re seeing the red fluorescence mixed with reflected violet light. To make the effect even clearer, place a piece of green paper or plastic next to the leaf; switch the position of the laser light between the leaf and the nonliving item. The contrast will be very clear. (You can use other colors of the nonliving item.)

PICTURES TO COME

Laser pointer with violet output

Video for frames to grab – shining on leaf, then on green paper, then back again

Why does this work? Chl absorbs both red and blue, with blue including even violet (recall the colors that abut each other in the rainbow). Chl has then two different electronic states of higher energy or excited states. One absorbs blue and violet, the other absorbs red. The blue-absorbing state is called S­ or the Singlet excited state number 2, and the red one is called S1. The singlet designation is very interesting, concerning the spin of electrons, but we’ll skip that detail for now. It takes light of higher energy in the violet or blue to excite Chl to the S2 state. The S2 state turns into the S1 state with extreme rapidity, dumping the excess energy as heat.

Let’s talk a bit about energy in light. The color of light is tied to its energy content. Light actually consists of individual bits called photons that act as both waves and particles (an amazing property in quantum mechanics). Light is characterized by its wavelength, which can be measured in various ways. Violet light from the laser pointer has a wavelength of 405 nanometers or nm; it’s barely visible to humans. That’s less than one-hundredth of the diameter of a typical human hair. Red light has a longer wavelength of 640 nm, and much lower energy.

So, violet light hitting the leaf pushes chlorophyll molecules into the high-energy S2 state; that decays extremely rapidly to the S1 state, which then rapidly emits red fluorescent light. Not all of the Chl molecules turn the energy into light; the efficiency of fluorescence isn’t 100%.

We can, however, make it higher than in a leaf, by taking Chl out of the leaf into solution. Grind up a leaf with a good solvent that’s not watery (water, for one, knocks the central magnesium atom out of the molecule, turning into a drab and inactive pheophytin molecule). I have used various handy solvents, including ordinary alcohol (ethanol) in a very pure state (190 proof if sold for consumption), wood alcohol (methanol, harder to buy), or acetone (nail polish remover). Put the leaf and the solvent in some vessel in which you can grind vigorously. The solvent will turn a rewarding green color. Shine the violet laser light on this solution and the red fluorescence will be vivid!

The fluorescence in solution is far stronger than in the leaf because it’s the main route for the Chl molecules to dispose of their energy. In contrast, in the leaf the energy can be almost fully delivered to the biochemistry of photosynthesis (an intricate and amazing story in itself). That brings up a great idea now implemented on several satellites, including the NASA Orbiting Carbon Observatory-2 (OCO-2) that views the whole Earth. The amount of fluorescence should drop when the plant is actively doing photosynthesis and rise when photosynthesis is cut back because the plant is stressed, such as by lack of water or extremes of temperature. Images from this satellite are now used to measure rates of photosynthesis and amounts of plant stress across the planet!

None of us has our own satellite to get data in a demo, though we can get the images and even the data. Let’s go back to what we have on hand. We’ve considered using the red and the violet laser pointers. There’s still a green laser pointer in the very inexpensive set. Can it tell us anything? Only indirectly. Chlorophyll doesn’t absorb green light; out of the red, green, and blue in sunlight it leaves the green, almost entirely. Leaves do have extra or auxiliary pigments to absorb a fair amount of the green light and pass some of that energy toward Chl molecules. Leaves can than absorb about 85% of the visible light from the Sun. To see this action, you might try using the green laser pointer while viewing the leaf through a filter that blocks green light. You can buy such filters at several places, including Edmund Scientific. You might see red fluorescence excited by a green laser pointer. Expect that this won’t work on a solution of chlorophyll, since you’ve lost some or most of the auxiliary pigments or put them in te wrong physical relation to the chlorophylls.

A note of caution: Of course, laser pointers are hazardous to your sight, as they are such concentrated sources of light. Don’t point them in your eye or anyone else’s eye. This is particularly dangerous with the green laser pointer. Green light is generated from far more intense infrared light by a process called frequency doubling. There’s a large amount of infrared light that can’t be converted, and that can really burn the eye.

I have another post/page that goes into more detail about why chlorophyll is such a magnificent molecule. Please check it out. This write-up is somewhat deep into the science, note.

Elephant toothpaste, two ways

MORE PICTURES TO COME

Elephant toothpaste: lotsa foam! Well, I’ve seen many elephants in the wild in Kenya, but I have to admit none was brushing his or her teeth. Still, here’s a dramatic generation of bubbles and foam from simple household items. The explanation leads to additional interesting concepts.

Equipment and supplies: hydrogen peroxide – regular home strength (3%) or super-duty hair-salon strength (20%); packaged yeast or compressed wet yeast (“cake yeast”); dish detergent; a tall cylinder such as a laboratory graduated cylinder, about 30 cm (1’) high and 4 cm wide (around 2”); a wide basin to catch the foam; for the follow-on experiments, a heat source (e.g., a microwave oven) and a cup to hold the yeast mix, an old alkaline cell, C or D size, side-cutters, and a small spoon.

Precautions: This is a pretty safe demo. If you proceed to the experiments with heat and with contents of an old battery (cell, really), take care to avoid getting scalded or cut.

Start with a demo, end with experiments. For the demo, put about 100 ml (around ½ cup, in old English units) of hydrogen peroxide into the cylinder. Add dish detergent and swirl the cylinder to mix it in. In a cup, put about 30 ml (2 Tbsp.) of warm – not hot – water, then add the yeast. Mix the yeast around and let it activate for a few minutes. You’ll get a thick-ish suspension of the yeast. Add it quickly to the peroxide/detergent! A rapid fountain of bubbles shoots up and over the top of the cylinder. Be sure to catch the overflow in a basin.

VIDEO TO COME

What happened? Yeast cells, as almost all living cells, have the extremely active enzyme, catalase, to protect them from oxygen in some of its dangerous forms. Start with the idea of a catalyst: it’s an item – a solid, a protein in solution, whatever – that increases the rate of a chemical reaction while ending up unchanged in the end. It participates in the “middle” of a chemical reaction but leaves it after speeding up the reaction. The cells in your body have several thousand different kinds of enzymes that catalyze almost every last chemical reaction that keeps you going. They not only speed the biochemical reactions but also control their rates, precisely. Catalysts occur all over the place. Gasoline is made from oil with the help of catalysts, precious metals on supporting structures. Ammonia as an agricultural fertilizer is made in quantities of more than 180 million tonnes (metric tons, 1000 kilograms each) every year, again using catalyst.

OK, why catalase, specifically? What’s the danger of oxygen? Many living cells such as our own use oxygen as the oxidizer to combine with fuels (sugars, fats, etc.) to release energy in controlled fashion. The process has a number of steps. At several steps, it’s possible to generate forms of oxygen that are potentially damaging to the other contents of the cell. One of these is peroxide, such as the hydrogen peroxide we added externally in this demo. A single molecule of catalase can break down almost 3 million molecules of hydrogen peroxide per second to water and normal gaseous oxygen. The reaction is written as

Variation: a second demo, or an experiment: Is catalase “alive”? OK, no chemical by itself is alive, only the whole set of chemicals in an intact cell or organism. However, what if the yeast cells are dead? Is catalase still active?

* You can experiment with ways to kill the yeast cells before adding them to the peroxide+detergent mix, or

* You can follow the instructions here as just a demonstration, though you will learn some more principles of science

As the demo: Let’s kill the yeast cells. They have no feeling, and you kill them in baking a yeast-raised bread or pastry, while the species lives on. One way to kill the cells is to heat them. After you make the yeast and water slurry, put the cup with them into the microwave and briefly boil them. Be careful not to have the slurry boil over. Let the slurry cool down so that the temperature is about the same as the first demo, to show that any changes in performance are not from temperature differences (learn to change one experimental variable at a time, if it’s possible). Add the slurry to a new peroxide+detergent mix. Does it foam really well? OK, if I don’t tell you what happens, it’s partly an experiment, beyond just a demo.

Variation: a third demo, or an experiment: Are there other things that can act as a catalyst to break down hydrogen peroxide quickly?

* You can experiment with them, trying them out, adding them to the peroxide+detergent mix.

* You can follow the instructions here as just a demonstration, though you will learn some more principles of science

As the demo: Let’s use manganese dioxide from an old alkaline cell (commonly called a battery, which is not really correct; batteries are made up of two or more cells). Cut into the cell with care not to cut yourself. I find it practical to use side-cutters (PICTURE), first, end-on to puncture the zinc wall, then in chewing motions to really open up the interior. The black sludge is manganese dioxide or some product of its reaction to make electricity. Scoop some out and mix it in water to make a slurry, as you did with yeast. Add the slurry to a new peroxide+detergent mix. Does it foam really well? Well, it foams, but far, far more slowly than with yeast. Nothing beats catalase as a catalyst for decomposing peroxide.

test MT to image

Converting MathType equations to images:

Kutools converted very few equations to images!

Saving a docx as html had the same problem.

Then I simply copied any MT equation, pasted it in a docx like this one, and pasted it in with the 4th choice, as image!

The choice icon looks like a mountain scene!

Now check that this conversion to image does work. Put this document onto a webpage with Mammoth .docx conveter

  1. (in free space). Then


This is classic one-over-r-squared law for the falloff of power with distance. With R = radius of the Sun (0.696 million km) and R’ = mean radius of the Earth’s orbit (150 million km),

If we want a planet with an energy flux density that’s the same as for Earth (so that it has about the same temperature), we want the total power of the star spread out at the planet’s orbital distance to be like that for the Earth:


Test hi-res2

Sidebar. The Hertzsprung-Russell diagram of star temperature and luminosity

Stars vary dramatically in color and brightness:

Hubble Space Telescope image of the Sagittarius Star Cloud. The image shows many stars of various colors, white, blue, red and yellow spread over a black background. The most common star colors in this image are red and yellow.

Sagittarius Star Cluster. credit: Hubble Heritage Team (AURA/STScI/NASA

Untold numbers of observations of stars show distinctive regularities in their attributes. Many of the stars cluster along a line called the Main Sequence when their luminosity (to be defined shortly) is plotted against their temperature or associated color (more light in the blue waveband than in the visible equates to hotter).

In the early 1900s two astronomers independently developed an eponymous plot that shows this: Ejnar Hertzsprung in Denmark and Henry Norris Russell in the US:

R. Hollow, Commonwealth Scientific and Industrial Research Organization

R. Hollow, Commonwealth Scientific and Industrial Research Organization

A bit about the definition of luminosity used in the plot: As astronomers even before the era of CCD-cameras made their observations, they quantified the brightness of stars. At our point of observation, it is the flux of photons per area of whatever we use to catch the radiation – our eyes, a photographic plate, a CCD camera recording. This apparent luminosity can be converted to an absolute luminosity, accounting for stars being at various distances from us (see below). The absolute luminosity can be cited two ways:

  • A magnitude, with the star Vega as the starting point of magnitude 0. Every increase in magnitude is a decrease in luminosity of a factor of 2.512. This is a logarithmic scale, base 2.512. A difference of 5 magnitudes is a difference of a factor of 100. (Why this scale? Ask astronomer Norman Robert Pogson, or maybe not, since he died in 1891.) To keep in mind that higher numerical magnitude corresponds to lower luminosity, think of it as a ranking – 7th is lower than 2nd, as among tennis pros. Note that magnitudes need not be integers. They can be 2.3, 4.7, …;
  • A value relative to the luminosity of the Sun. The Sun is a wimpy magnitude-4.83 star. Sirius has magnitude 1.42. That’s 3.41 magnitudes higher, a factor of 23 in total output.

The physical origin of the tight pattern along the Main Sequence became clear as:

  • The process of nuclear fusion was discovered and characterized. These stars are in their early lives and are fusing hydrogen to helium as a main process. They’re in a common mode;
  • The variation of luminosity with simple distance from us could be corrected. A hot distant star might look less luminous than a cool nearby star. If we can measure the distance, r, we can compare stars as if they are all at a common distance, r0 (astronomers use 10 parsecs or 37 light-years). We may then multiply the apparent luminosity, a raw measure, by the factor (r/r0)2. This yields the defined absolute luminosity.

The physics, in brief: Going up and to the left we have stars that are hotter (therefore, bluer) and brighter, in a clear relation.

  • These stars have higher mass. As noted in the main text, they fuse hydrogen faster. They are hotter.
  • Stars largely radiate as blackbodies.
  • Blackbodies have peak emission at a wavelength that is inversely proportional to the temperature. For Sirius at a temperature of 9,940K, the peak is at 292 nm, in the “blue” band (really, the ultraviolet). For the Sun at 5800K, the peak is at 500 nm, in the yellow band. For our close relation, Proxima Centauri at 3042K, it is at 953 nm, in the red band (actually, the near infrared).
  • Blackbodies have total radiant energy output in proportion to absolute temperature to the fourth power, T4. Given the dynamics of hydrogen fusion, T rises roughly as mass to the 0.6 power; T4 then rises about as m2.4.
  • A second contribution to luminosity is the area of the star’s surface. It rises in approximate proportion to mass to the 1.2 power.
  • Thus, total radiated power – and resultant luminosity – rises nearly as m3.6. This omits the “clipping” of recorded radiation when it gets too short or too long in wavelength to be recorded in the detector.

All told, then, mass determines temperature and luminosity in these stars, in a tight relation.

What about the stars toward the top and right? While the Main Sequence is a sequence in mass and not in time. The Sun will not move to higher or lower mass while burning hydrogen, outside of a fraction of a percent from mass-to-energy conversion. Still, stars in later life can move off the Main Sequence. Stars 10 times the mass of the Sun or more start fusing helium, inflating and getting cooler but very much more luminous. An example is monstrous Betelgeuse. Such stars fuse to a core of iron, the most stable nuclide. They then explode as type II supernovae. Betelgeuse is ripe to do so, in perhaps as few as a thousand years by some estimates. Stars not quite as massive can blow off their outer layers to leave a hot, very dense, but low-luminosity white dwarf. Some massive stars leave enough mass intact to become those enigmatic neutron stars or even small black holes (the really big black holes are huge accumulations of many stellar masses in the centers of galaxies). Some neutron stars, the magnetars, have mind-boggling magnetic fields that contribute to emission of intensely powerful beams of X-rays and gamma rays. All these special stars came into our ken long after Hertzsprung and Russell made their diagram. There’s always something new under the Sun, as it were.

There are many more details in the paths by which stars evolve. There are many online and printed sources to follow this topic.


Test Word pix

Sidebar. The Hertzsprung-Russell diagram of star temperature and luminosity

Stars vary dramatically in color and brightness:

Hubble Space Telescope image of the Sagittarius Star Cloud. The image shows many stars of various colors, white, blue, red and yellow spread over a black background. The most common star colors in this image are red and yellow.

Sagittarius Star Cluster. credit: Hubble Heritage Team (AURA/STScI/NASA

Untold numbers of observations of stars show distinctive regularities in their attributes. Many of the stars cluster along a line called the Main Sequence when their luminosity (to be defined shortly) is plotted against their temperature or associated color (more light in the blue waveband than in the visible equates to hotter).

In the early 1900s two astronomers independently developed an eponymous plot that shows this: Ejnar Hertzsprung in Denmark and Henry Norris Russell in the US:

R. Hollow, Commonwealth Scientific and Industrial Research Organization

R. Hollow, Commonwealth Scientific and Industrial Research Organization

A bit about the definition of luminosity used in the plot: As astronomers even before the era of CCD-cameras made their observations, they quantified the brightness of stars. At our point of observation, it is the flux of photons per area of whatever we use to catch the radiation – our eyes, a photographic plate, a CCD camera recording. This apparent luminosity can be converted to an absolute luminosity, accounting for stars being at various distances from us (see below). The absolute luminosity can be cited two ways:

  • A magnitude, with the star Vega as the starting point of magnitude 0. Every increase in magnitude is a decrease in luminosity of a factor of 2.512. This is a logarithmic scale, base 2.512. A difference of 5 magnitudes is a difference of a factor of 100. (Why this scale? Ask astronomer Norman Robert Pogson, or maybe not, since he died in 1891.) To keep in mind that higher numerical magnitude corresponds to lower luminosity, think of it as a ranking – 7th is lower than 2nd, as among tennis pros. Note that magnitudes need not be integers. They can be 2.3, 4.7, …;
  • A value relative to the luminosity of the Sun. The Sun is a wimpy magnitude-4.83 star. Sirius has magnitude 1.42. That’s 3.41 magnitudes higher, a factor of 23 in total output.

The physical origin of the tight pattern along the Main Sequence became clear as:

  • The process of nuclear fusion was discovered and characterized. These stars are in their early lives and are fusing hydrogen to helium as a main process. They’re in a common mode;
  • The variation of luminosity with simple distance from us could be corrected. A hot distant star might look less luminous than a cool nearby star. If we can measure the distance, r, we can compare stars as if they are all at a common distance, r0 (astronomers use 10 parsecs or 37 light-years). We may then multiply the apparent luminosity, a raw measure, by the factor (r/r0)2. This yields the defined absolute luminosity.

The physics, in brief: Going up and to the left we have stars that are hotter (therefore, bluer) and brighter, in a clear relation.

  • These stars have higher mass. As noted in the main text, they fuse hydrogen faster. They are hotter.
  • Stars largely radiate as blackbodies.
  • Blackbodies have peak emission at a wavelength that is inversely proportional to the temperature. For Sirius at a temperature of 9,940K, the peak is at 292 nm, in the “blue” band (really, the ultraviolet). For the Sun at 5800K, the peak is at 500 nm, in the yellow band. For our close relation, Proxima Centauri at 3042K, it is at 953 nm, in the red band (actually, the near infrared).
  • Blackbodies have total radiant energy output in proportion to absolute temperature to the fourth power, T4. Given the dynamics of hydrogen fusion, T rises roughly as mass to the 0.6 power; T4 then rises about as m2.4.
  • A second contribution to luminosity is the area of the star’s surface. It rises in approximate proportion to mass to the 1.2 power.
  • Thus, total radiated power – and resultant luminosity – rises nearly as m3.6. This omits the “clipping” of recorded radiation when it gets too short or too long in wavelength to be recorded in the detector.

All told, then, mass determines temperature and luminosity in these stars, in a tight relation.

What about the stars toward the top and right? While the Main Sequence is a sequence in mass and not in time. The Sun will not move to higher or lower mass while burning hydrogen, outside of a fraction of a percent from mass-to-energy conversion. Still, stars in later life can move off the Main Sequence. Stars 10 times the mass of the Sun or more start fusing helium, inflating and getting cooler but very much more luminous. An example is monstrous Betelgeuse. Such stars fuse to a core of iron, the most stable nuclide. They then explode as type II supernovae. Betelgeuse is ripe to do so, in perhaps as few as a thousand years by some estimates. Stars not quite as massive can blow off their outer layers to leave a hot, very dense, but low-luminosity white dwarf. Some massive stars leave enough mass intact to become those enigmatic neutron stars or even small black holes (the really big black holes are huge accumulations of many stellar masses in the centers of galaxies). Some neutron stars, the magnetars, have mind-boggling magnetic fields that contribute to emission of intensely powerful beams of X-rays and gamma rays. All these special stars came into our ken long after Hertzsprung and Russell made their diagram. There’s always something new under the Sun, as it were.

There are many more details in the paths by which stars evolve. There are many online and printed sources to follow this topic.