
Sidebar. The Hertzsprung-Russell diagram of star temperature and luminosity
Stars vary dramatically in color and brightness:
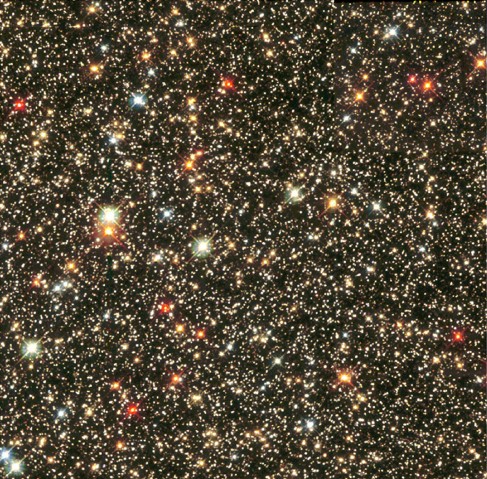
Sagittarius Star Cluster. credit: Hubble Heritage Team (AURA/STScI/NASA
Untold numbers of observations of stars show distinctive regularities in their attributes. Many of the stars cluster along a line called the Main Sequence when their luminosity (to be defined shortly) is plotted against their temperature or associated color (more light in the blue waveband than in the visible equates to hotter).
In the early 1900s two astronomers independently developed an eponymous plot that shows this: Ejnar Hertzsprung in Denmark and Henry Norris Russell in the US:
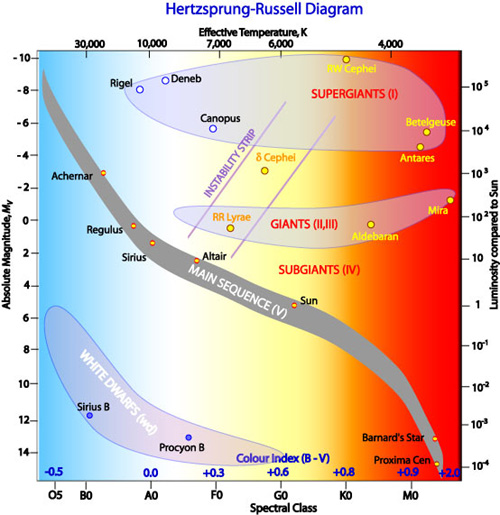
R. Hollow, Commonwealth Scientific and Industrial Research Organization
R. Hollow, Commonwealth Scientific and Industrial Research Organization
A bit about the definition of luminosity used in the plot: As astronomers even before the era of CCD-cameras made their observations, they quantified the brightness of stars. At our point of observation, it is the flux of photons per area of whatever we use to catch the radiation – our eyes, a photographic plate, a CCD camera recording. This apparent luminosity can be converted to an absolute luminosity, accounting for stars being at various distances from us (see below). The absolute luminosity can be cited two ways:
- A magnitude, with the star Vega as the starting point of magnitude 0. Every increase in magnitude is a decrease in luminosity of a factor of 2.512. This is a logarithmic scale, base 2.512. A difference of 5 magnitudes is a difference of a factor of 100. (Why this scale? Ask astronomer Norman Robert Pogson, or maybe not, since he died in 1891.) To keep in mind that higher numerical magnitude corresponds to lower luminosity, think of it as a ranking – 7th is lower than 2nd, as among tennis pros. Note that magnitudes need not be integers. They can be 2.3, 4.7, …;
- A value relative to the luminosity of the Sun. The Sun is a wimpy magnitude-4.83 star. Sirius has magnitude 1.42. That’s 3.41 magnitudes higher, a factor of 23 in total output.
The physical origin of the tight pattern along the Main Sequence became clear as:
- The process of nuclear fusion was discovered and characterized. These stars are in their early lives and are fusing hydrogen to helium as a main process. They’re in a common mode;
- The variation of luminosity with simple distance from us could be corrected. A hot distant star might look less luminous than a cool nearby star. If we can measure the distance, r, we can compare stars as if they are all at a common distance, r0 (astronomers use 10 parsecs or 37 light-years). We may then multiply the apparent luminosity, a raw measure, by the factor (r/r0)2. This yields the defined absolute luminosity.
The physics, in brief: Going up and to the left we have stars that are hotter (therefore, bluer) and brighter, in a clear relation.
- These stars have higher mass. As noted in the main text, they fuse hydrogen faster. They are hotter.
- Stars largely radiate as blackbodies.
- Blackbodies have peak emission at a wavelength that is inversely proportional to the temperature. For Sirius at a temperature of 9,940K, the peak is at 292 nm, in the “blue” band (really, the ultraviolet). For the Sun at 5800K, the peak is at 500 nm, in the yellow band. For our close relation, Proxima Centauri at 3042K, it is at 953 nm, in the red band (actually, the near infrared).
- Blackbodies have total radiant energy output in proportion to absolute temperature to the fourth power, T4. Given the dynamics of hydrogen fusion, T rises roughly as mass to the 0.6 power; T4 then rises about as m2.4.
- A second contribution to luminosity is the area of the star’s surface. It rises in approximate proportion to mass to the 1.2 power.
- Thus, total radiated power – and resultant luminosity – rises nearly as m3.6. This omits the “clipping” of recorded radiation when it gets too short or too long in wavelength to be recorded in the detector.
All told, then, mass determines temperature and luminosity in these stars, in a tight relation.
What about the stars toward the top and right? While the Main Sequence is a sequence in mass and not in time. The Sun will not move to higher or lower mass while burning hydrogen, outside of a fraction of a percent from mass-to-energy conversion. Still, stars in later life can move off the Main Sequence. Stars 10 times the mass of the Sun or more start fusing helium, inflating and getting cooler but very much more luminous. An example is monstrous Betelgeuse. Such stars fuse to a core of iron, the most stable nuclide. They then explode as type II supernovae. Betelgeuse is ripe to do so, in perhaps as few as a thousand years by some estimates. Stars not quite as massive can blow off their outer layers to leave a hot, very dense, but low-luminosity white dwarf. Some massive stars leave enough mass intact to become those enigmatic neutron stars or even small black holes (the really big black holes are huge accumulations of many stellar masses in the centers of galaxies). Some neutron stars, the magnetars, have mind-boggling magnetic fields that contribute to emission of intensely powerful beams of X-rays and gamma rays. All these special stars came into our ken long after Hertzsprung and Russell made their diagram. There’s always something new under the Sun, as it were.
There are many more details in the paths by which stars evolve. There are many online and printed sources to follow this topic.
