https://science-technology-society.com/wp-content/uploads/2023/09/The-advantage-of-analytical-solutions.pdf
Solving the equations for the decay of radioactive elements
Here is an exposition of a very useful method of solution:
Precise Calculation of Complex Radioactive Decay ChainsTest unite gallery
Here is a start
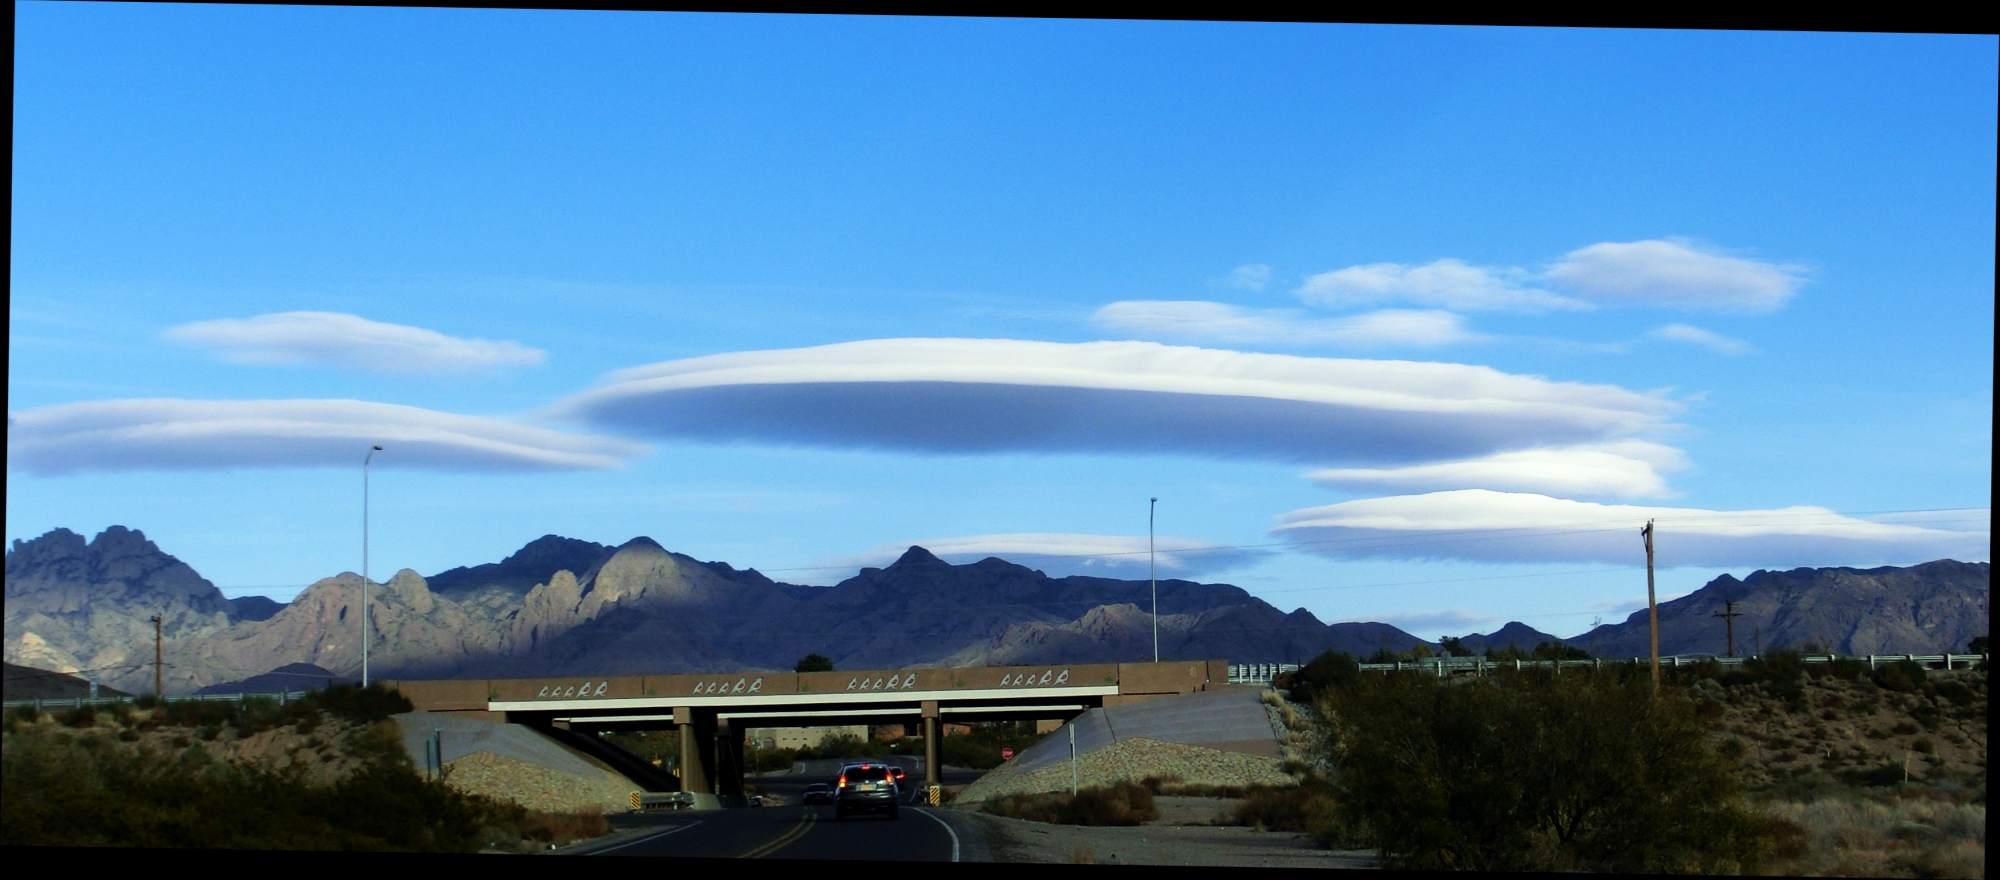
Cloud in a bottle
MORE PICTURES TO BE ADDED
METEOROLOGY
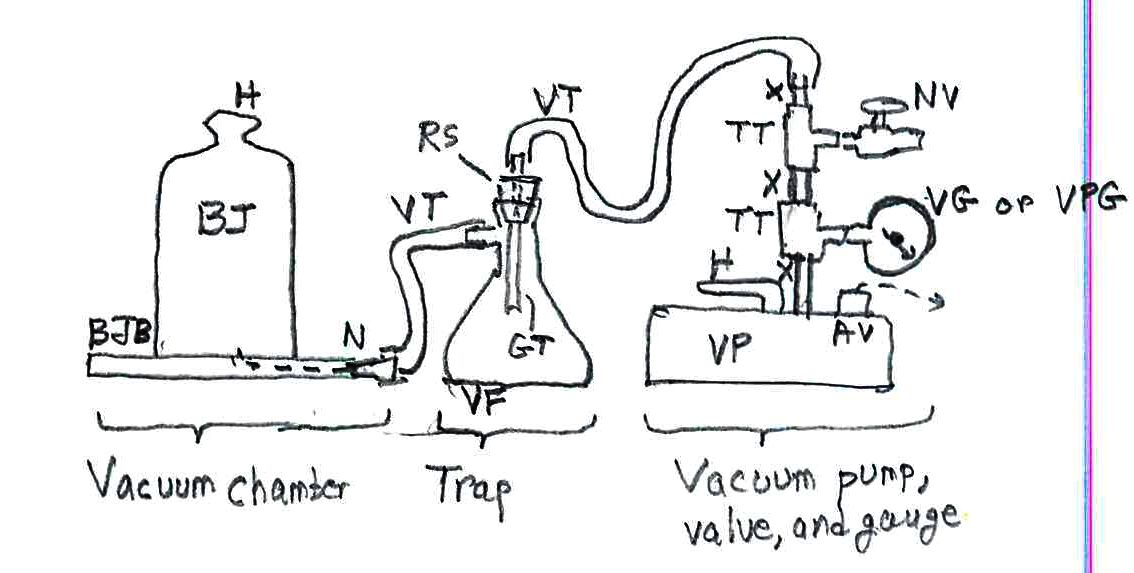
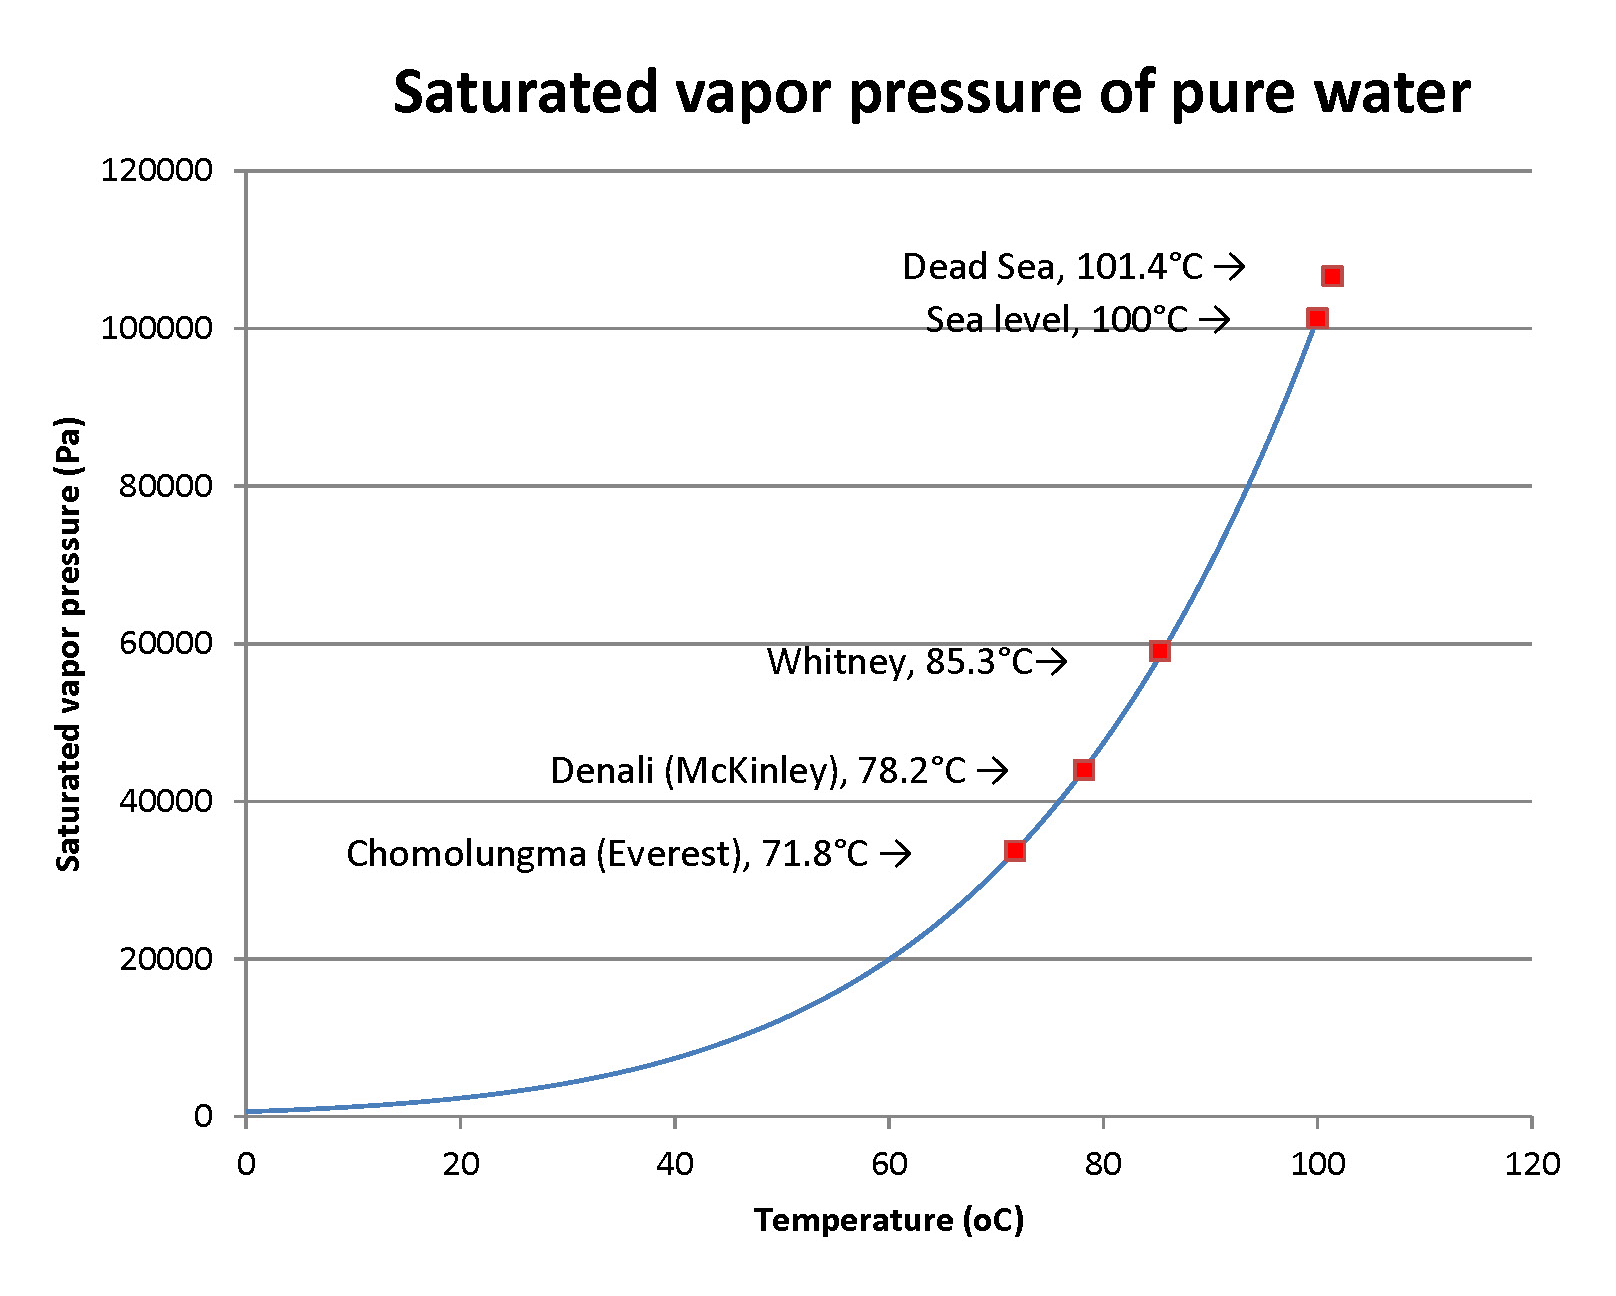
Making your own small clouds with a hard squeeze: A plastic bottle, a bit of water, and a match will lead you to appreciate how some clouds form. If you have a thermocouple thermometer, you can dig a bit further. Here’s the link for the full story.
Cloud in a bottle: This is a simple demonstration of phenomena in forming clouds in nature.
Equipment: minimal, cheap.
You fill a clear, squeezable bottle with saturated vapor – you do that by putting a little water in the bottom of the bottle and shaking and swirling it around for, oh, say, a minute. Next, you light a match and put it in the mouth of the bottle and shake it to extinguish the flame and introduce smoke into the bottle, then quickly capping it. If you feel safer, you might light a longer piece of wood, or a cork punk. Now squeeze the bottle hard and then release it sharply. The interior will fill with mist, which is tiny water droplets that condensed around the tinier smoke particles. You can keep squeezing and then releasing the bottle several times to get the effect.
The principle is that the sudden expansion of the air in the bottle decreases its temperature to the point that it is below the condensation point of the water vapor. To put it technically, the expansion is adiabatic, without exchanging any significant heat with the outside air. There are several discussions of the temperature effect, which also explains the decrease of temperature as air goes to higher elevations in steady (nonturbulent) conditions; my explanation using the physics is on another post in these webpages. Of course, the squeezing is the opposite effect. To make the demo more detailed, you can run a fine-wire thermocouple thermometer into the bottle through a tiny hole in the lid, sealing it thoroughly. You can run the thermocouple end to a thermocouple thermometer as I’ve done in this picture. You’ll see the temperature rise on squeezing the bottle and fall on letting it expand.
PICTURE
Video for frames to grab – filling it with a bit of water, shaking it, lighting a match, putting it out to make smoke, sealing the bottle, squeezing it, releasing it, and doing it again
Picture of a cap with a hole
Picture of Omega TCT with lead and with reading
Picture of TC threaded into hole and sealed
Video of squeezing while viewing the TCT and the bottle contents
STEM equipment and supplies
Post test read more
Let’s try the “Read more” insert. I’ll create the post in text (HTML) and insert “Read more” within this editing environment, which should avoid formatting errors that can occur if it’s inserted within the visual mode Continue reading “Post test read more”
test MT to image
Converting MathType equations to images:
Kutools converted very few equations to images!
Saving a docx as html had the same problem.
Then I simply copied any MT equation, pasted it in a docx like this one, and pasted it in with the 4th choice, as image!
The choice icon looks like a mountain scene!
Now check that this conversion to image does work. Put this document onto a webpage with Mammoth .docx conveter
![]()

![]()
- (in free space). Then
This is classic one-over-r-squared law for the falloff of power with distance. With R = radius of the Sun (0.696 million km) and R’ = mean radius of the Earth’s orbit (150 million km),

If we want a planet with an energy flux density that’s the same as for Earth (so that it has about the same temperature), we want the total power of the star spread out at the planet’s orbital distance to be like that for the Earth:
![]()
Test hi-res2
Sidebar. The Hertzsprung-Russell diagram of star temperature and luminosity
Stars vary dramatically in color and brightness:

Sagittarius Star Cluster. credit: Hubble Heritage Team (AURA/STScI/NASA
Untold numbers of observations of stars show distinctive regularities in their attributes. Many of the stars cluster along a line called the Main Sequence when their luminosity (to be defined shortly) is plotted against their temperature or associated color (more light in the blue waveband than in the visible equates to hotter).
In the early 1900s two astronomers independently developed an eponymous plot that shows this: Ejnar Hertzsprung in Denmark and Henry Norris Russell in the US:

R. Hollow, Commonwealth Scientific and Industrial Research Organization
R. Hollow, Commonwealth Scientific and Industrial Research Organization
A bit about the definition of luminosity used in the plot: As astronomers even before the era of CCD-cameras made their observations, they quantified the brightness of stars. At our point of observation, it is the flux of photons per area of whatever we use to catch the radiation – our eyes, a photographic plate, a CCD camera recording. This apparent luminosity can be converted to an absolute luminosity, accounting for stars being at various distances from us (see below). The absolute luminosity can be cited two ways:
- A magnitude, with the star Vega as the starting point of magnitude 0. Every increase in magnitude is a decrease in luminosity of a factor of 2.512. This is a logarithmic scale, base 2.512. A difference of 5 magnitudes is a difference of a factor of 100. (Why this scale? Ask astronomer Norman Robert Pogson, or maybe not, since he died in 1891.) To keep in mind that higher numerical magnitude corresponds to lower luminosity, think of it as a ranking – 7th is lower than 2nd, as among tennis pros. Note that magnitudes need not be integers. They can be 2.3, 4.7, …;
- A value relative to the luminosity of the Sun. The Sun is a wimpy magnitude-4.83 star. Sirius has magnitude 1.42. That’s 3.41 magnitudes higher, a factor of 23 in total output.
The physical origin of the tight pattern along the Main Sequence became clear as:
- The process of nuclear fusion was discovered and characterized. These stars are in their early lives and are fusing hydrogen to helium as a main process. They’re in a common mode;
- The variation of luminosity with simple distance from us could be corrected. A hot distant star might look less luminous than a cool nearby star. If we can measure the distance, r, we can compare stars as if they are all at a common distance, r0 (astronomers use 10 parsecs or 37 light-years). We may then multiply the apparent luminosity, a raw measure, by the factor (r/r0)2. This yields the defined absolute luminosity.
The physics, in brief: Going up and to the left we have stars that are hotter (therefore, bluer) and brighter, in a clear relation.
- These stars have higher mass. As noted in the main text, they fuse hydrogen faster. They are hotter.
- Stars largely radiate as blackbodies.
- Blackbodies have peak emission at a wavelength that is inversely proportional to the temperature. For Sirius at a temperature of 9,940K, the peak is at 292 nm, in the “blue” band (really, the ultraviolet). For the Sun at 5800K, the peak is at 500 nm, in the yellow band. For our close relation, Proxima Centauri at 3042K, it is at 953 nm, in the red band (actually, the near infrared).
- Blackbodies have total radiant energy output in proportion to absolute temperature to the fourth power, T4. Given the dynamics of hydrogen fusion, T rises roughly as mass to the 0.6 power; T4 then rises about as m2.4.
- A second contribution to luminosity is the area of the star’s surface. It rises in approximate proportion to mass to the 1.2 power.
- Thus, total radiated power – and resultant luminosity – rises nearly as m3.6. This omits the “clipping” of recorded radiation when it gets too short or too long in wavelength to be recorded in the detector.
All told, then, mass determines temperature and luminosity in these stars, in a tight relation.
What about the stars toward the top and right? While the Main Sequence is a sequence in mass and not in time. The Sun will not move to higher or lower mass while burning hydrogen, outside of a fraction of a percent from mass-to-energy conversion. Still, stars in later life can move off the Main Sequence. Stars 10 times the mass of the Sun or more start fusing helium, inflating and getting cooler but very much more luminous. An example is monstrous Betelgeuse. Such stars fuse to a core of iron, the most stable nuclide. They then explode as type II supernovae. Betelgeuse is ripe to do so, in perhaps as few as a thousand years by some estimates. Stars not quite as massive can blow off their outer layers to leave a hot, very dense, but low-luminosity white dwarf. Some massive stars leave enough mass intact to become those enigmatic neutron stars or even small black holes (the really big black holes are huge accumulations of many stellar masses in the centers of galaxies). Some neutron stars, the magnetars, have mind-boggling magnetic fields that contribute to emission of intensely powerful beams of X-rays and gamma rays. All these special stars came into our ken long after Hertzsprung and Russell made their diagram. There’s always something new under the Sun, as it were.
There are many more details in the paths by which stars evolve. There are many online and printed sources to follow this topic.
Test Word pix
Sidebar. The Hertzsprung-Russell diagram of star temperature and luminosity
Stars vary dramatically in color and brightness:

Sagittarius Star Cluster. credit: Hubble Heritage Team (AURA/STScI/NASA
Untold numbers of observations of stars show distinctive regularities in their attributes. Many of the stars cluster along a line called the Main Sequence when their luminosity (to be defined shortly) is plotted against their temperature or associated color (more light in the blue waveband than in the visible equates to hotter).
In the early 1900s two astronomers independently developed an eponymous plot that shows this: Ejnar Hertzsprung in Denmark and Henry Norris Russell in the US:

R. Hollow, Commonwealth Scientific and Industrial Research Organization
R. Hollow, Commonwealth Scientific and Industrial Research Organization
A bit about the definition of luminosity used in the plot: As astronomers even before the era of CCD-cameras made their observations, they quantified the brightness of stars. At our point of observation, it is the flux of photons per area of whatever we use to catch the radiation – our eyes, a photographic plate, a CCD camera recording. This apparent luminosity can be converted to an absolute luminosity, accounting for stars being at various distances from us (see below). The absolute luminosity can be cited two ways:
- A magnitude, with the star Vega as the starting point of magnitude 0. Every increase in magnitude is a decrease in luminosity of a factor of 2.512. This is a logarithmic scale, base 2.512. A difference of 5 magnitudes is a difference of a factor of 100. (Why this scale? Ask astronomer Norman Robert Pogson, or maybe not, since he died in 1891.) To keep in mind that higher numerical magnitude corresponds to lower luminosity, think of it as a ranking – 7th is lower than 2nd, as among tennis pros. Note that magnitudes need not be integers. They can be 2.3, 4.7, …;
- A value relative to the luminosity of the Sun. The Sun is a wimpy magnitude-4.83 star. Sirius has magnitude 1.42. That’s 3.41 magnitudes higher, a factor of 23 in total output.
The physical origin of the tight pattern along the Main Sequence became clear as:
- The process of nuclear fusion was discovered and characterized. These stars are in their early lives and are fusing hydrogen to helium as a main process. They’re in a common mode;
- The variation of luminosity with simple distance from us could be corrected. A hot distant star might look less luminous than a cool nearby star. If we can measure the distance, r, we can compare stars as if they are all at a common distance, r0 (astronomers use 10 parsecs or 37 light-years). We may then multiply the apparent luminosity, a raw measure, by the factor (r/r0)2. This yields the defined absolute luminosity.
The physics, in brief: Going up and to the left we have stars that are hotter (therefore, bluer) and brighter, in a clear relation.
- These stars have higher mass. As noted in the main text, they fuse hydrogen faster. They are hotter.
- Stars largely radiate as blackbodies.
- Blackbodies have peak emission at a wavelength that is inversely proportional to the temperature. For Sirius at a temperature of 9,940K, the peak is at 292 nm, in the “blue” band (really, the ultraviolet). For the Sun at 5800K, the peak is at 500 nm, in the yellow band. For our close relation, Proxima Centauri at 3042K, it is at 953 nm, in the red band (actually, the near infrared).
- Blackbodies have total radiant energy output in proportion to absolute temperature to the fourth power, T4. Given the dynamics of hydrogen fusion, T rises roughly as mass to the 0.6 power; T4 then rises about as m2.4.
- A second contribution to luminosity is the area of the star’s surface. It rises in approximate proportion to mass to the 1.2 power.
- Thus, total radiated power – and resultant luminosity – rises nearly as m3.6. This omits the “clipping” of recorded radiation when it gets too short or too long in wavelength to be recorded in the detector.
All told, then, mass determines temperature and luminosity in these stars, in a tight relation.
What about the stars toward the top and right? While the Main Sequence is a sequence in mass and not in time. The Sun will not move to higher or lower mass while burning hydrogen, outside of a fraction of a percent from mass-to-energy conversion. Still, stars in later life can move off the Main Sequence. Stars 10 times the mass of the Sun or more start fusing helium, inflating and getting cooler but very much more luminous. An example is monstrous Betelgeuse. Such stars fuse to a core of iron, the most stable nuclide. They then explode as type II supernovae. Betelgeuse is ripe to do so, in perhaps as few as a thousand years by some estimates. Stars not quite as massive can blow off their outer layers to leave a hot, very dense, but low-luminosity white dwarf. Some massive stars leave enough mass intact to become those enigmatic neutron stars or even small black holes (the really big black holes are huge accumulations of many stellar masses in the centers of galaxies). Some neutron stars, the magnetars, have mind-boggling magnetic fields that contribute to emission of intensely powerful beams of X-rays and gamma rays. All these special stars came into our ken long after Hertzsprung and Russell made their diagram. There’s always something new under the Sun, as it were.
There are many more details in the paths by which stars evolve. There are many online and printed sources to follow this topic.
Spinlaunch is demonstrably impossible
An investment in an impractical technology
Summary of the impracticality of Spinlaunch
The New Mexico Spaceport (https://www.spaceportamerica.com/), funded by taxpayers, started with Virgin Galactic’s space tourism entity as its anchor tenant. It has gained other tenants, thought not yet economically sustainable; space tourism may start in late 2019.
One new tenant is Spinlaunch, a company from Sunnyvale, California (http://www.spinlaunch.com/). They’ve raised $40M from investors (https://www.bloomberg.com/news/articles/2018-06-14/this-startup-got-40-million-to-build-a-space-catapult) including Google Ventures (now GV) and Airbus Ventures for a speculative technology, which I shall describe shortly below. They propose to use a large spinning platform to launch satellites from the ground (which must be with a rocket to complete the boost).
The idea sounded preposterous to me, so I worked out the limitations, which I claim are solidly against this being practical or even possible. Join me now:
The basic technology proposed is:
- A vacuum chamber with a radius of about 50 m (Bill Gutman from Spaceport America let out the knowledge that my first estimate of 500 m was “an order of magnitude too high;” pushing on a completely unrealistic guess helped spring this information loose).
- Bill says it’s patented, but there’s only a patent application dated July 2018, US 2018/0194496 Al to Jonathan Yaney.
- I note that a patent says nothing about the practicality of an “invention.” Patent examiners are not allowed to decide on issuing a patent based on practicality. I note that Henry Latimer Simmons obtained patent 536,360 for a ludicrous invention to let one train pass over the top of another on one track.
- Placing the satellite with its rocket motor on the periphery and spinning up to a tangential speed of Mach 4-5, as Bill cites. Yes, it could not be to LEO (Low Earth Orbit) speed; of course, the satellite would burn up on launch here in the lower atmosphere.
- Upon launch a rocket engine ignites to reach the speed for attaining LEO.
Calculations:
- I’ll take the lower speed, Mach 4, about 1,320 m s-1 to give the least stressful conditions.
- At a radius r = 50 m and a speed v = 1320 m s-1, the centrifugal acceleration is very simply calculated as v2/r = 34,850 m s-2. That’s very closely 3,500 g! We’re talking about a satellite and its rocket engine withstanding this, including electronics
- Bill Gutman says that there are already military projectiles that get accelerated to 40,000 to 50,000 g – to get a muzzle velocity of 1,000 m s-1 in a 10-m barrel. The electronics are potted to withstand the acceleration (https://www.raytheon.com/capabilities/products/excalibur).
- Fine, but:
- (1) A satellite has to have folded solar panels and antennae. These cannot be potted, and I cannot imagine any folding and cushioning that doesn’t destroy the joints or the panels. The military projectiles only have to deploy small vanes to steer. (I also don’t know how their performance meets specs.)
- (2) To reach vLEO (calculations below), there has to be a rocket engine. It will have to be a solid propellant engine; the complex plumbing and pumps of a liquid-fueled engine could not possibly survive 3500 g.
- This engine should really be two-stage. An effective vLEO of over 8,000 m s-1 is needed, with a bit of thrust vectoring to go from horizontal to tangential in the trajectory, as well as to overcome drag in the initial part of the trajectory. I get an estimate closer to 9200 m s-1, not achievable with one stage with solid propellant; see below. The exact calculation of air drag would similar to the math from interceptors such as Nike or the more modern (and low-effectiveness) GMD. So, the additional speed needed is well over 6,700 m s-1.
- The classic rocket equation expresses the gain in speed (yes, let’s say speed, since direction is not specified and does change) is Δv = vex ln(m0/mf), where vex is the exhaust velocity as determined by the propellant type and m0 and mf are the initial and final masses of the rocket. I’ve written this up, too (https://science-technology-society.com/wp-content/uploads/2018/01/rocket_equation_in_free_space.pdf). We assume the loss of mass is that of propellant. Taking the final hull and payload (satellite) as having a mass of only 10% of the initial mass (90% burn), we get the logarithmic factor as ln(10)=2.3.
- Solid propellants have only a moderate vex, hitting about 2,500 m s-1. We get Δv=5,750 m s-1. Yes, I’d say that a second stage is necessary.
- (3) Can a solid-propellant rocket withstand the lateral acceleration? Of course, the rocket has to point up, so the rocket and payload are aligned perpendicularly to the radius. There is an enormous bending force exerted on the rocket body. The force also gets relieved almost instantaneously on launch, generating a change in acceleration called, appropriately, jerk. This sets parts of the launched item into sharp motion – like your innards if you’re in a high-speed traffic accident.
- (4) How big a satellite can be launched, given materials limitations? There are some small satellites, e.g., the CubeSats, but they have economical and reliable launches already on standard rockets. For more practical sizes, I’m not about to do the engineering calculations to estimate the stresses on the launch platform and the safety factor. This assumes that the payload and its own rocket survive, which I flatly reject, as above. I note that:
- The proposed device would only fit small rockets and satellites, of notably smaller dimension than the spinning platform. There is a mature technology and market for launching (and making) CubeSats (https://makezine.com/2014/04/11/your-own-satellite-7-things-to-know-before-you-go/). Maybe Spinlaunch is aiming (but wildly off) at slightly larger satellites.
- (5) The whole idea was to save energy and cost in launching satellites. There’s a lot of energy put into the launch mechanism, far more than the kinetic energy imparted to the (putative) rocket + payload. Maybe some could be recovered in electromagnetic braking…needing a significant amount of electrical storage and circuits to handle massive currents.
There are other niceties:
- Consider the extremely active timing needed to release the rocket + payload. Suppose we want a launch direction error not to exceed 1o, or 1/57 of a radian. To reach a tangential speed of 1320 m s-1 at a radius r = 50 m, one needs a rotation rate of 1320/50 = 26.4 radians s-1. That’s a bit over 1,500 degrees per second. The window is less than 1 ms wide.
- Safety: What’s the shield in case the launch mechanism fails, sending out shard at high speed? How about releasing the rocket + payload nearly horizontally by accident? You need a BFS, a big functional shield.
- How about the reaction of the spinning platform when the rocket + payload is released? That’s quite a jolt on the suspension. Maybe some engineers can address that, but not the fundamental no-gos (a neologism?) I’ve noted all through.
Conclusion:
- This is a pipe dream or a scam, poorly thought out at the very best.
- Yes, Google Ventures, now known as spinoff GV, and Airbus Ventures are among the investors in this. I can only attribute their lack of due diligence to their lack of sufficient technical expertise – I think Google and Airbus, both technically solid, spun off the MBAs and not the engineers into their Ventures.
The rest of the analysis uses equations set by MathType in Microsoft Word. These don’t come through in the Mammoth docx converter plug-in to WordPress, so I link here to a PDF version of the rest of the analysis.


